Churn: the annual rate in which customers leave a brand.
As marketers, we’re always looking at ways to retain and nurture the customers we have, and thus keep churn at a minimum.
We know that it costs much more time and money—65-80% of your marketing budget—to acquire a new customer versus retaining an existing customer. The acquisition cost of a new customer is a significant investment and with each customer we lose, we lose the return on the initial investment.
That brings up two questions:
- Why don’t we allocate more spend towards nurturing and growing our relationships with our existing customers?
- How can we reduce churn? If we could identify trends in behaviors that indicate customer churn, we could incorporate strategies to mitigate that risk and increase retention.
Here are 3 Must-Have Metrics That Indicate Churn Potential:
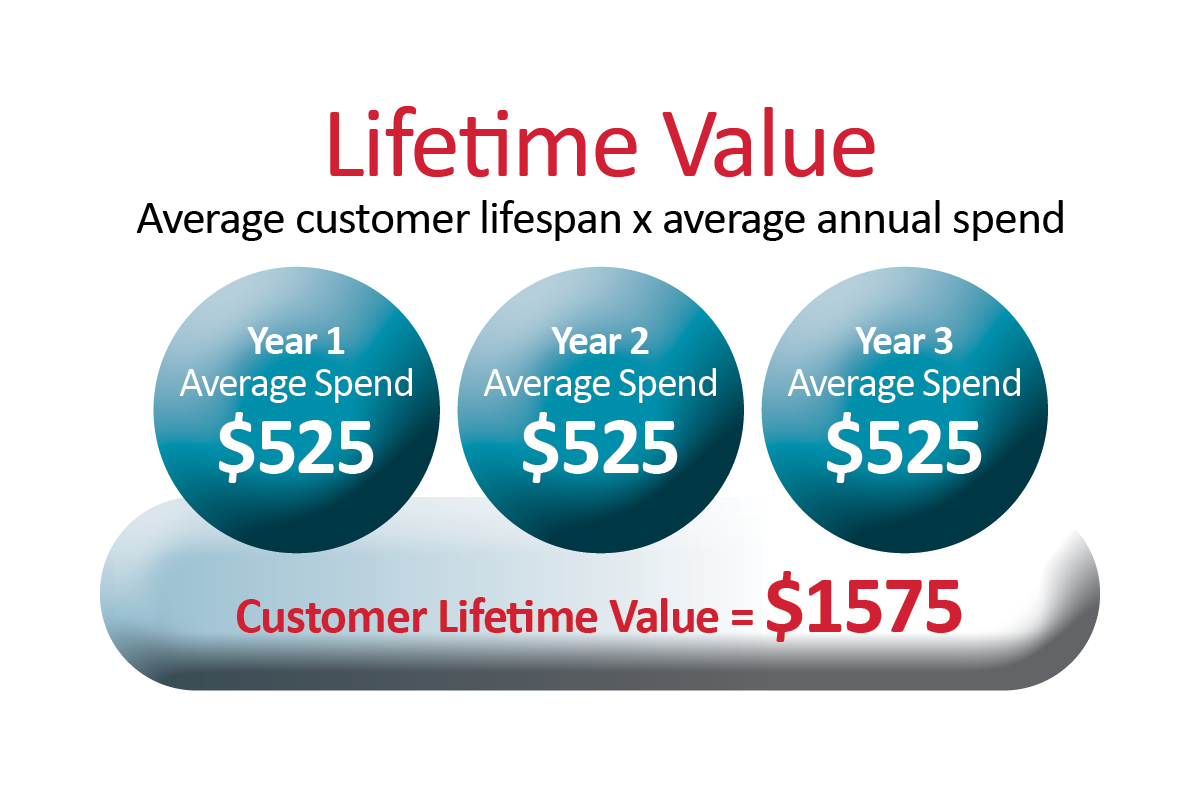
(1) Tracking Lifetime Value (LTV):
Bringing in new customers is one way to increase the revenue trajectory, and as a rule, businesses spend 5x more to acquire a new customer versus what they spend to retain an existing customer. However, this business model can only be successful if we can achieve the right Lifetime Value (LTV) from the customers we acquire.
Different customer segments can have significantly different Lifetime Values (LTV) based upon their buying behavior (average annual spend) and length of relationship (average customer lifespan). A decline in LTV over time could be an indicator of churn. Measuring and monitoring your customer segments against your LTV benchmarks can help you identify customers that are at risk for churn and put tactics in place to mitigate attrition.
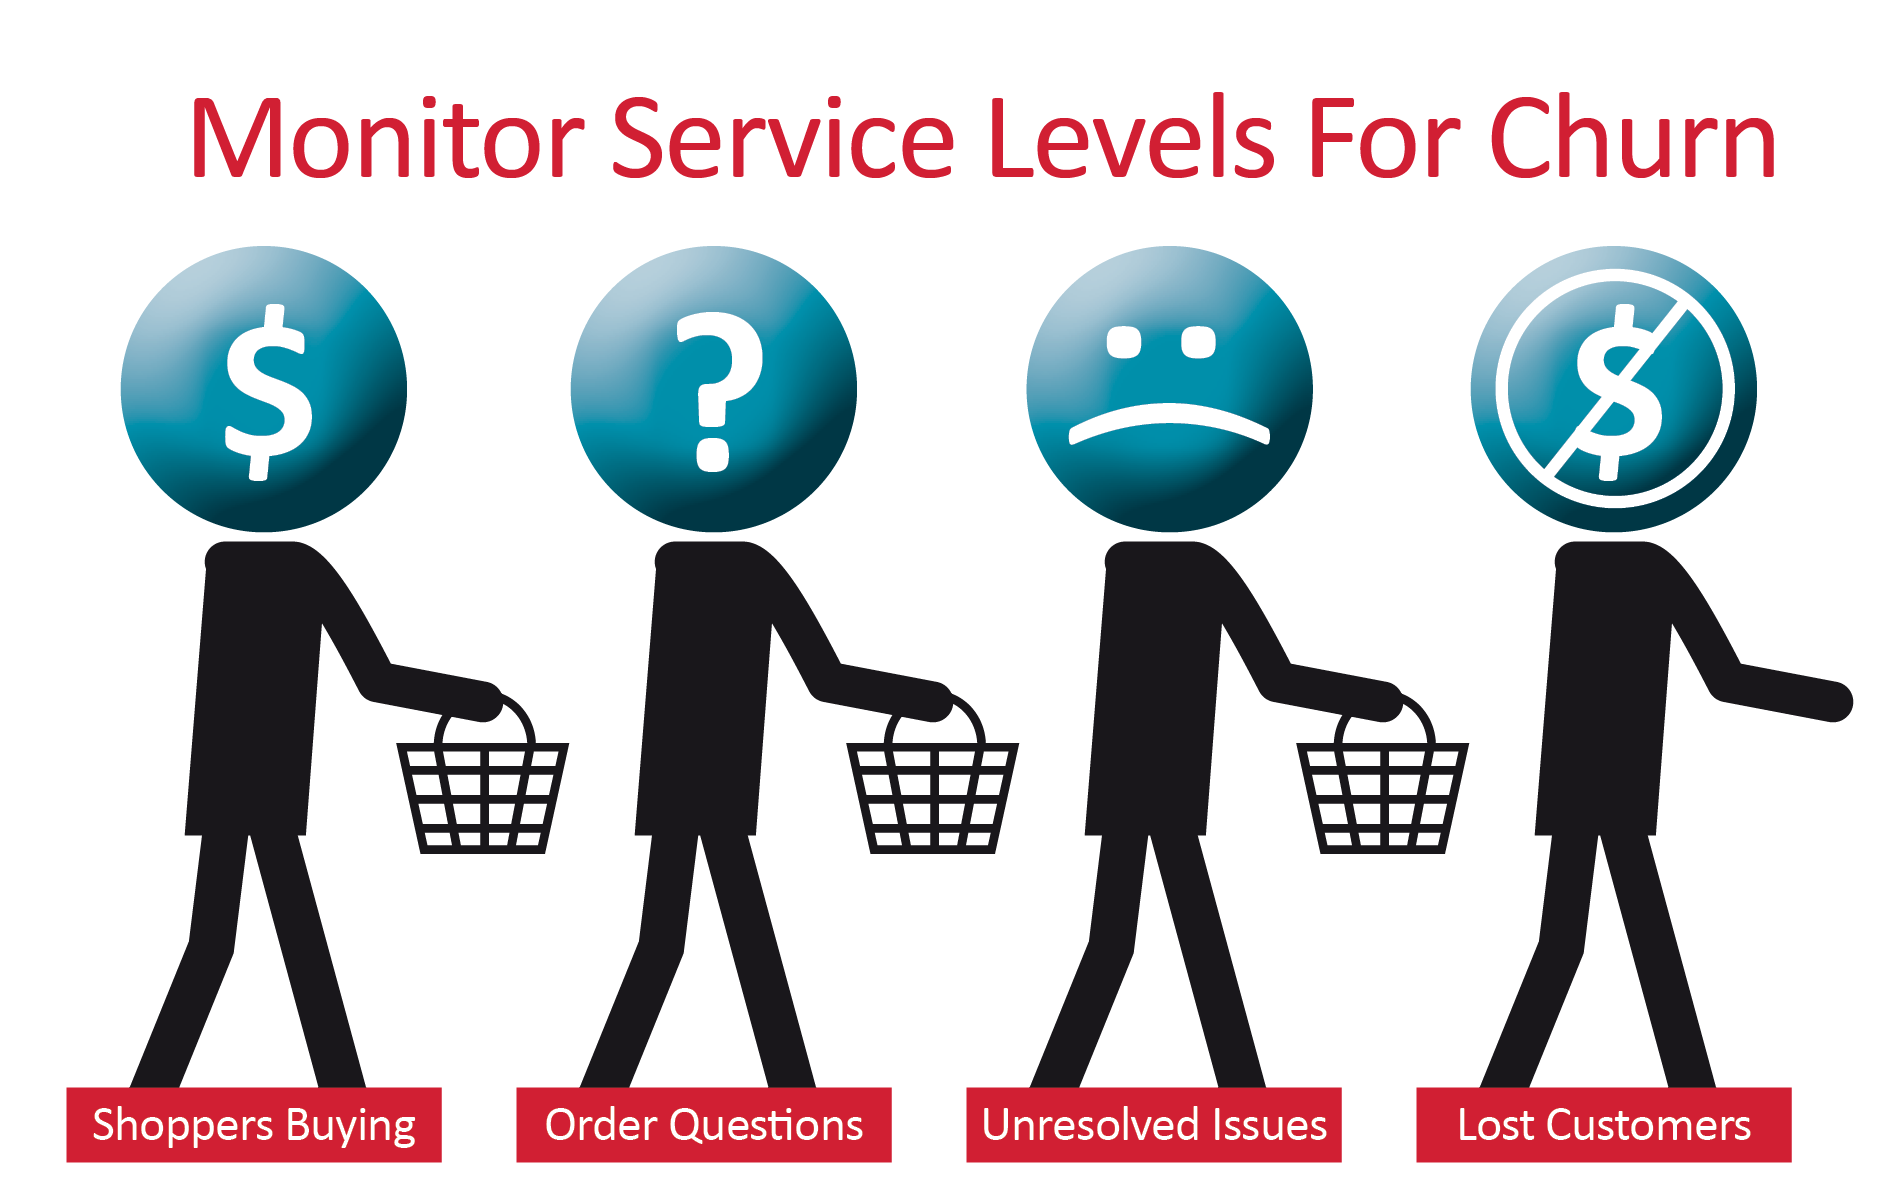
(2) Monitoring Service Scores:
Most businesses recognize that the way to win in customer retention is to win in service. Changes in marketing strategies can drive an increase in leads and conversions – which is a great thing. But you could find that your latest strategy is acquiring a different type of customer, with different value perceptions, and customer service expectations.
In order to control customer care costs, businesses are prioritizing more self-service models. Some customers are more comfortable with self-serving than others. If you see an increase in customer care visits and/or an increase in calling frequency to your customer care center from a customer, this could be an indicator of some unsolved customer issue which could lead to churn. Customers don’t expect businesses to be perfect, but they do expect them to be accessible and responsive when an issue comes up. Identifying an increase in call volume or online customer care visits could be an indicator of an at-risk customer.
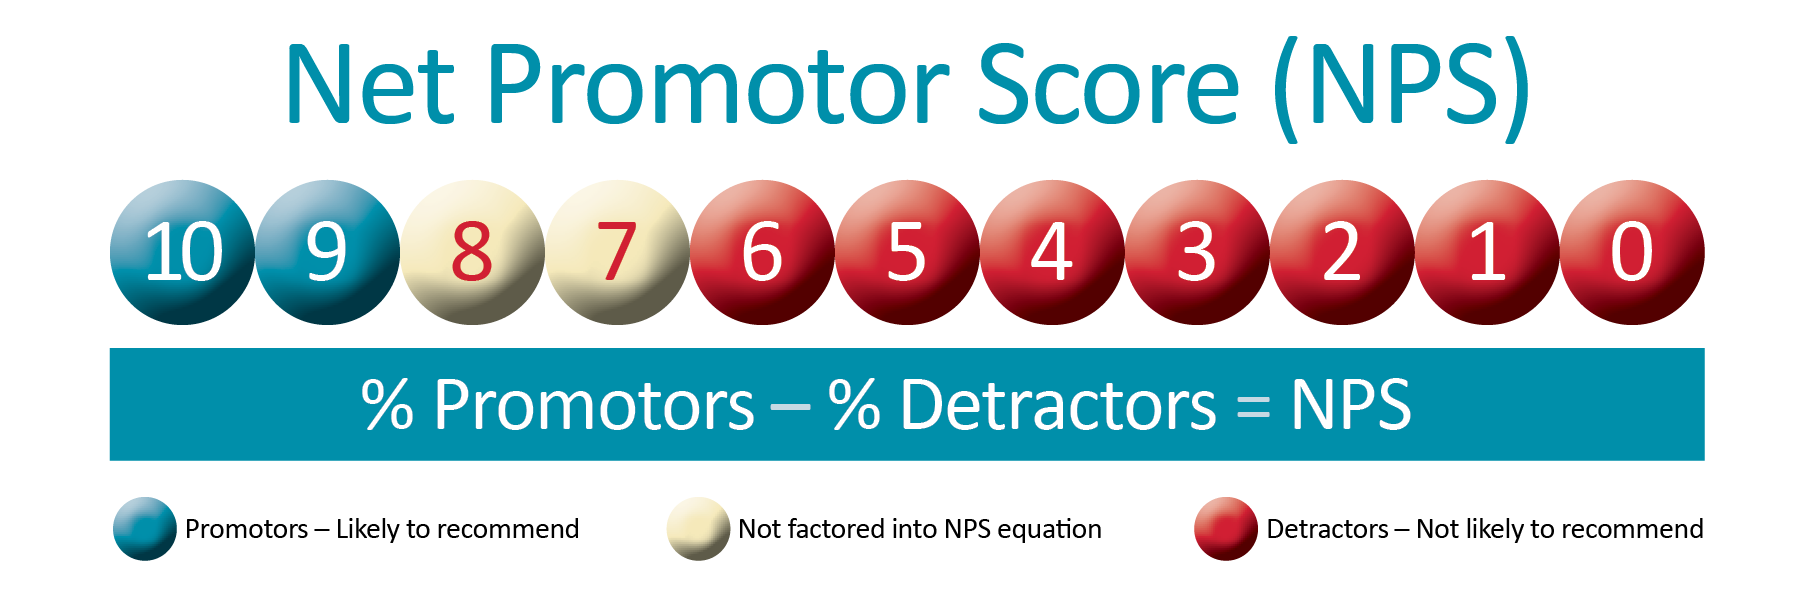
(3) Individualizing Satisfaction Ratings:
Net Promotor Score (NPS) is a common way to measure satisfaction at an aggregated level and has proven to be a good indicator of future growth. If applied at the individual level, it is incredibly valuable. Consider asking the Net Promoter survey question—How likely are you to recommend [product/service] to a friend or colleague? This can be asked at the point your customers exit their purchase experience without being too intrusive. Then you can add this Recommendation Rating to the individual record. It will help you identify who your Promoters are (those happy customers who are likely to recommend your product or service) (score 9-10), who your passive customers are (Score 7-8), and who your potentially unhappy customers are who could be sharing negative word of mouth and be at risk for leaving your brand. If you can identify these customers, you can address them and potentially reduce their churn rate.
Customers tell us by their behaviors whether they are satisfied or dissatisfied with our products or services. By analyzing the right metrics and identifying trends, we can discover where our customers are experiencing a decline in value. If a customer perceives they can receive a better value somewhere else, that is where they will go. By identifying your businesses predictors of churn, you will know where to focus your efforts to improve your return on investment (ROI).
As marketers, we spend a lot of time and money to acquire new customers and we want to ensure that we get the most of that investment—many satisfied, repeat customers, purchasing more over a long-term relationship with our brand and telling all of their friends and colleagues about their great experience with our brand.
You may also like these other articles in the Customer Intelligence series:
- Customer Intelligence: What You Don’t Know Could Hinder Your Sales & Marketing Growth [Customer Intelligence Series Part 1 of 5]
- Getting Smart About Customer Segmentation: 5 Steps To Get More Bang for your Marketing Buck [Customer Intelligence Series Part 2 of 5]
- Customer Profiling: 4 Steps to Unlocking your Brand’s Secret Weapon [Customer Intelligence Series Part 3 of 5]
For more marketing tips, tricks, and insights, you can subscribe to our blog in right column of this page and subscribe to our YouTube channel here.
To see the full Customer Intelligence video series, see the links below:
- Part 1: Customer Intelligence: What You Don't Know Could Hinder Your Sales & Marketing Growth
- Part 2: 5 Steps To Get More Bang for your Marketing Buck Through Customer Segmentation
- Part 3: Customer Profiling: 4 Steps to Unlocking your Brand’s Secret Weapon
- Part 4: Predicting the Future: The 3 Must-Have Metrics That Reveal Customer Churn Potential
- Part 5: How to Write a Business Case Using Customer Intelligence Data
- Part 6: Customer Intelligence in a Nutshell: CI Recap
You can also download our predictive customer intelligence white paper and enter for your chance to win a customer profiling and response modeling (worth $10K below).

Thank you for watching! We hope this has helped with further understanding the power of CI! Please leave a comment below or reach out to us here, so we can help you with any further questions you may have.