In the second installment of our five-part Customer Intelligence Series, we will continue to discuss the components of Customer Intelligence. If you missed part 1, you can find it here.
Are your customers the same? Or are they different? If they are different, by how much? And does it really matter? In business, we find that our customers usually have percentages of sameness and uniqueness. The key to smart segmentation is understanding which attributes of a group of customers distinguish them from the rest and which of these attributes are most predictive of the behavior that will enable us to meet our specific business goals and objectives.
What is “Customer Segmentation”?
Segmentation is defined by the Oxford Dictionary as “a division into separate parts or sections.” So Customer Segmentation would be defined as customers that are divided into separate categories or sub-segments of the customer database based upon similar propensities.
Why is this important?
What if I told you that within 90 days, you would be able to spend the same amount of marketing budget while increasing your return on investment by 10%? Would you be interested in hearing more? Or what if your marketing budget is cut by 25%, but your revenue objectives remain the same.
Would you know where to trim your marketing spend with the least amount of impact to short- and long-term revenue?
Let’s take a look at an example use case and see how this might play out. Say that you have a customer database of 100,000 records and that this database includes personal information, demographic and psychographic data, and lists of transactions and purchases. Due to budget restraints, you have only been marketing to 60% of your customers over the past 3 years with an average response rate of 1.2% and a conversion rate of 15%. Your yearly objective is to increase your return on investment (ROI) by 10%. How would you spend your marketing budget to achieve this objective?
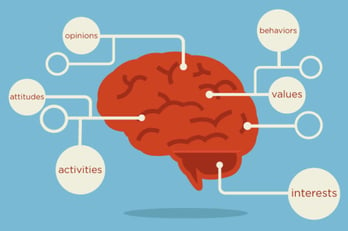
Psychographic data is based on:
1. Define/refine your objectives. How do you define success? Overall increase in revenue? Incremental revenue to a specific product line? Or reduction in marketing spend while achieving the same results?
2. Enhance and analyze your historical data. Understanding the similarities and differences of your customers’ psychographics and shopping and buying behavior will provide insights into your most profitable and least profitable customers.
3. Segment your customers into quintiles (five distinct groups). Leverage your learnings from the historical analysis and align these with your overall objectives to divide your customers into the most appropriate segments based upon profitability, propensity to respond, propensity to convert, propensity to increase spend, etc., with Group 1 being your most favorable customer group and Group 5 being your least favorable customer group.
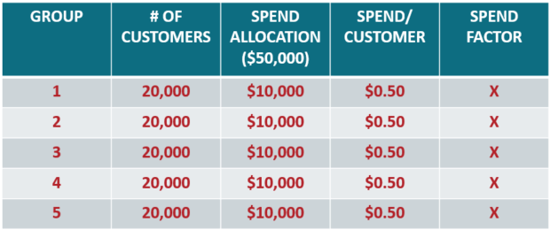
Example 1: Segmentation without using data insights to rank customers:
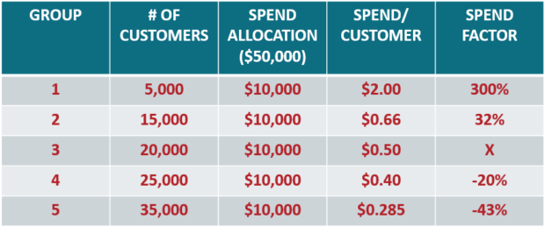
*Spend Factor = the % of the total budget allocated towards the quintile. Ideally, you are looking to put more money against what works best!
4. Allocate marketing spend. For this example, we’ll assume that increasing ROI is your objective. Since you have now identified your most profitable customers in Group 1, you’ll want to increase your marketing spend and channel allocation toward that group of customers while reducing your marketing spend for your least profitable customers.
Example 2: Segmentation using data insights to rank customers:
In the above grid, Group 1 are the most valuable customers who will be allocated more spend per person for a more personalized touch, versus Group 5 (least valuable) who will receive fewer or less expensive interactions.
5. Test. Enhance. Test. It is important to continue to monitor the performance of your marketing activities and models at predetermined intervals. And continue to test and learn.
Nothing stays the same. As your marketing strategy changes, your customers’ behavior may change as well. And in the age of Big Data, you have more data and analytical tools at your disposal than ever before. The challenge is knowing how to mine the data and find truly actionable insights. Once you have these insights, they can be applied to your marketing list strategy to find valuable prospects who look like your most profitable customers.
For more marketing tips, tricks, and insights, you can subscribe to our blog in right column of this page and subscribe to our YouTube channel here.
To see the full Customer Intelligence video series, see the links below:
- Part 1: Customer Intelligence: What You Don't Know Could Hinder Your Sales & Marketing Growth
- Part 2: 5 Steps To Get More Bang for your Marketing Buck Through Customer Segmentation
- Part 3: Customer Profiling: 4 Steps to Unlocking your Brand’s Secret Weapon
- Part 4: Predicting the Future: The 3 Must-Have Metrics That Reveal Customer Churn Potential
- Part 5: How to Write a Business Case Using Customer Intelligence Data
- Part 6: Customer Intelligence in a Nutshell: CI Recap
You can also download our predictive customer intelligence white paper and enter for your chance to win a customer profiling and response modeling (worth $10K below).
Thank you for watching! We hope this has helped with further understanding the power of CI! Please leave a comment below or reach out to us here, so we can help you with any further questions you may have.


